Why Measure STI & STIPA?
In almost all situations where speech is transmitted between a talker and a listener, it is degraded to some degree by the transmission channel. As the speech is degraded, it becomes less intelligible to the listener.
This may be due to:
Poor Signal-to-noise ratio
Psychoacoustic masking effects
Sound Pressure Level
Ambient noise level
Reverberation Time (RT60)
Reflections
Loudspeaker frequency response/orientation
Distortion
Background noise
Attenuation over distance/due to obstacles
For Public Address & General Alarm (PAGA), Public Address (PA), Voice Address (VA) and alarm systems, it is critical that messages are both audible and intelligible so that important instructions can be understood (for instance directions to the nearest exit in the event of an emergency). This is not only a primary concern of potentially hazardous areas such as industrial sites, factories, and oil/gas platforms, but also any area with large crowds such as stadiums, train stations, airports, shopping centers, and hospitals.
If emergency announcements are unintelligible or easily misunderstood due to poor system quality, tragic consequences may result. Therefore, it is essential to properly design, install, and verify the speech intelligibility of these reinforcement systems. Those who do so may even have legal or contractual requirements regarding specific speech intelligibility levels, which is where STI and STIPA are useful.
What Are STI & STIPA?
The Speech Transmission Index (STI) has emerged as a go-to metric for objective estimation of speech intelligibility in acoustical systems. STI is a relative of the Articulation Index (AI), which is based on speech-to-noise ratios across a wide range of frequencies. But unlike AI (and its successor, SII), STI also works well for estimating intelligibility in reverberant environments in addition to electronic communication systems.
Rather than estimating intelligibility based on direct-to-reverberant or signal-to-noise ratios, STI starts with the concept of speech as a carrier wave (i.e., sound from our vocal cords). This carrier wave is modulated by low frequency fluctuations as the speaker’s mouth and tongue move and change shape to form the phonemes within words. Looking at the example below, a segment of actual human speech, it is not hard to see how someone might arrive at that conclusion.
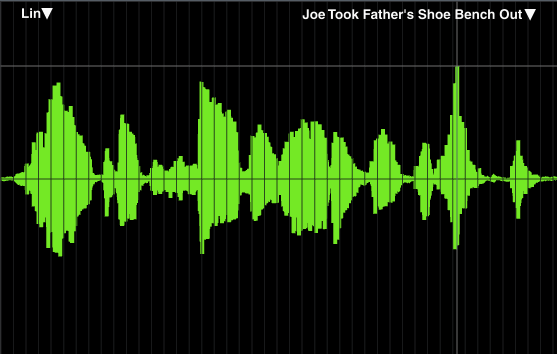
Recording of a male voice saying “Joe took father’s shoe bench out”.
The core concept of STI is that most of the information in speech is carried in these low-frequency modulations, and anything that reduces the depth of the modulations negatively affects speech intelligibility. An advantage of this approach is its sensitivity to just about any factor that works to degrade speech intelligibility in a sound system and/or a room including noise (ambient or electronic), excessive reverberation, distortion, and audible echoes.
The basis for calculating STI is the modulation Transfer Function (MTF), which quantifies the depth of modulation in the received signal relative to the transmitted signal at specified frequencies. This modulation transfer function can be either measured directly using specialized “speech-like” test signals or calculated indirectly from the Impulse Response or ETC of a system under test. In either case, it is measured over a range of seven octaves (from 125 Hz to 8 kHz) at fourteen modulation frequencies per band. The modulation frequencies range from 0.63 Hz to 12.5 Hz in 1/3-octave intervals.
A general caveat is that STI is sensitive to strongly fluctuating background noise levels, which can lead to overestimation of low intelligibility systems or underestimation of scores on the high end. When measuring in the presence of fluctuating background noise, at least three measurements should be taken and their results averaged to reduce measurement uncertainty. Also, if the speech source and a prominent source of background noise are widely separated, STI may underestimate intelligibility – but human hearing can be smarter than machines about that kind of thing. STI is also sensitive to clipping or Amplitude compression in the transmission channel, but in our case those would also violate the linear time-invariant system rule for transfer function measurements.
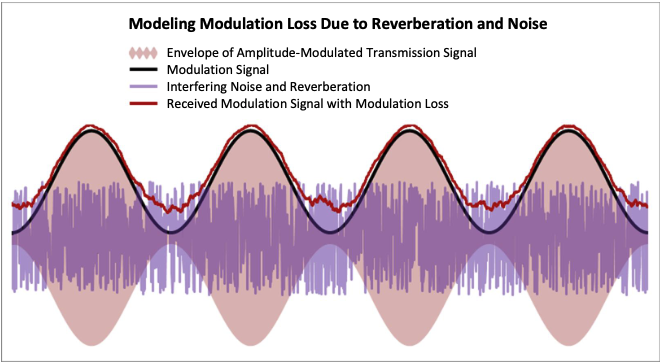
Modeling modulation loss due to reverberation and noise.
STI estimates speech intelligibility through a transmission channel as a function of modulation loss. In the figure above, the black line is the modulation signal for a transmitted signal. The red line is the modulation signal of the received transmission. The difference between the two (the modulation transfer function or MTF), quantifies loss of modulation due to factors such as reverberation and noise.
STIPA
A historic problem with the direct measurement of STI is that it takes a lot of time. The modulation frequencies are so closely spaced that each one has to be measured separately, and there are 98 (14 frequencies for 7 octaves) modulation frequencies in all. The full direct measurement therefore typically takes about 15 minutes. STI for Public Address systems (STIPA) was developed as a way to get around this problem.
STIPA is essentially the same measurement as STI but uses a subset of its modulation frequencies; two per octave, for a total of 14. Alternatively, STIPA is typically uses a speciallized test signal that excites all 14 frequencies at the same time, allowing the measurement to be completed in a single pass. STIPA measurements can be completed in a few seconds and have been found to correlate very well with the results from a more rigorous, full STI measurement.
In Smaart, of course, we measure STI indirectly from the impulse response and the full STI measurement takes no longer to perform than a typical direct measurement of STIPA. Smaart does provide figures for both STI and STIPA, however, but STIPA in our case is more properly termed STIPA(IR), since it is based on IR data rather than a direct measurement. It is provided for informational purposes, (such as to facilitate comparison with readings from hand-held STIPA meters) and is literally just a subset of the full STI measurement, calculated using exactly the same measurement data.
Qualitative Thresholds for STI and STIPA
STI is calculated from the change in modulation of a test signal, giving a value of between 0 and 1 (1 being the most intelligible and 0 the least).
These values (applying to a native speaker of the language being spoken) are evaluated as follows:
STI Range | Quality |
|---|---|
> 0.75 | Excellent |
0.60 - 0.74 | Good |
0.45 - 0.59 | Fair |
0.30 - 0.44 | Poor |
< 0.30 | Bad |
Some versions of the IEC standard on STI have included separate criteria for estimating male vs female speech intelligibility. However, female speech criteria for STI were omitted in the 2020 revision of the standard. Female speech is generally considered to be more intelligible than male speech, and so the worst-case scenario (male speech), makes a better benchmark for evaluating the overall capability of a system to reproduce speech intelligibly. STIPA, alternatively, has always been qualified only for male speech.
Analyzing STI with Smaart
Analyzing STI with Smaart is very simple to do. However, several factors must be considered when measuring an IR for STI analysis in order to obtain a meaningful result. The measurement and analysis procedures for indirect STI analysis are so interwoven that it would not make sense to discuss one without the other. For this reason, we have included a separate article covering these processes.
AlCons
ALCons (sometimes called %ALCons because it is stated as a percentage) stands for Articulation Loss of Consonants. Consonant sounds are critical to speech intelligibility and, since they are short in duration, can tend to get lost more easily than vowel sounds that are voiced over a longer period (and have more total energy as a result).
ALCons was originally conceived as an estimate based on room volume, reverberation, and distance of the listener from a sound source. This was commonly called the “architectural” form of ALCons. Later forms used an early-to-late energy ratio in place of room volume and listener distance, theoretically making ALCons directly measurable from an impulse response. The early-to-late energy ratio is conventionally measured in a 1/3-octave band centered on 2 kHz with a split time typically in the range of 10-20 milliseconds.
Direct measurement of ALCons from an IR, however, has never been standardized and remains somewhat controversial. That being said, two forms of direct ALCons calculation found their way into a number of acoustical measurement and analysis platforms, including Smaart. The earlier of the two forms did not take background noise into account, making it unsuitable for cases where noise was a significant factor affecting speech intelligibility. A later version that adds an adjustment for noise is informally called “long form” ALCons, to differentiate it from the earlier, “short form” calculation.
ALCons is inverted relative to other intelligibility metrics, in that lower values mean better scores.
ALCons ranges are typically evaluated as such:
ALCons % | Quality |
|---|---|
< 5% | Excellent |
5-10% | Good |
10-15% | Fair |
> 15% | Bad |