The SPL History Timeline is divided into two panes:
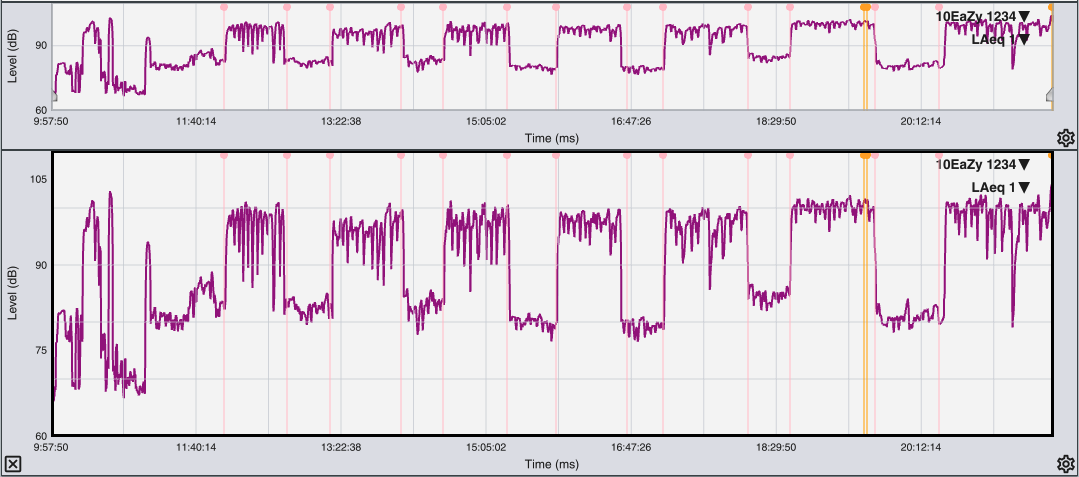
The SPL History Timeline.
The upper pane is the Navigation pane, which always shows the entire duration of the currently displayed logfile. The lower pane is the Detail pane, which allows you to zoom in on a designated time range and view multiple metrics overlaid at once.
Cursor Readout Data
One of the most important analysis tools in Smaart is the mouse cursor. In addition to operating the program’s controls, the cursor is used to find precise values for any point of interest in the SPL History Timeline. When you position the cursor over data in the plot, the Cursor Readout Area at the top of the history timeline displays information about the data under the cursor. The text in the cursor readout area is color-coded to match the data it describes.

The cursor readout area displays information about the data under the cursor. Note that the cursor readout is color coded to match the data in question.
Lollipop Markers
Smaart SPL uses color-coded “lollipop” markers in the SPL History Timeline to indicate certain events.
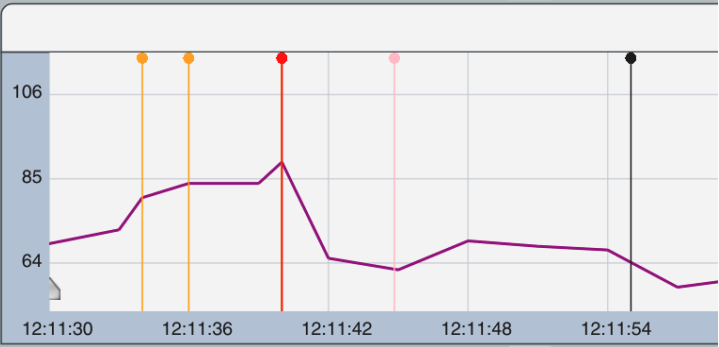
A portion of SPL History Timeline data showing two alarm markers (orange), an overload marker (red), a note marker (pink) and an Leq reset marker (black).
Notes (Pink)
To add a note to a an SPL timeline (whether previously logged or currently logging), either click the Add Note button in the Control Bar or press the [Space] bar. Notes are indicated as pink lollipop markers at the corresponding timestamp. These can be useful for noting the beginning or ending of a musical act’s set, a point when an HVAC system engages, or any other noteworthy event that may occur during logging. Hover your cursor over the marker to see the associated note’s text.
Leq Reset (White / Black)
Leq buffers can be manually reset one of three ways:
Using the Reset button in the Control Bar.
Right-clicking a floating SPL meter and selecting “Reset Leq Buffers for this Input”.
Using the [Alt/Opt] + [V] hot key.
When the Leq buffer is reset, the operation is indicated by either a white lollipop marker (when using the dark interface color scheme) or a black lollipop marker (when using the light interface color scheme).
Alarms (Orange)
Whenever a metric’s logged value exceeds the corresponding alarm threshold for that metric, an orange lollipop will indicate that the alarm has been triggered, along with an orange highlight that takes up the height of either plot for the duration of the alarm. The alarm state will persist until the metric’s measured value drops below the alarm threshold. Hover your cursor over the marker to see the metric associated with the alarm.
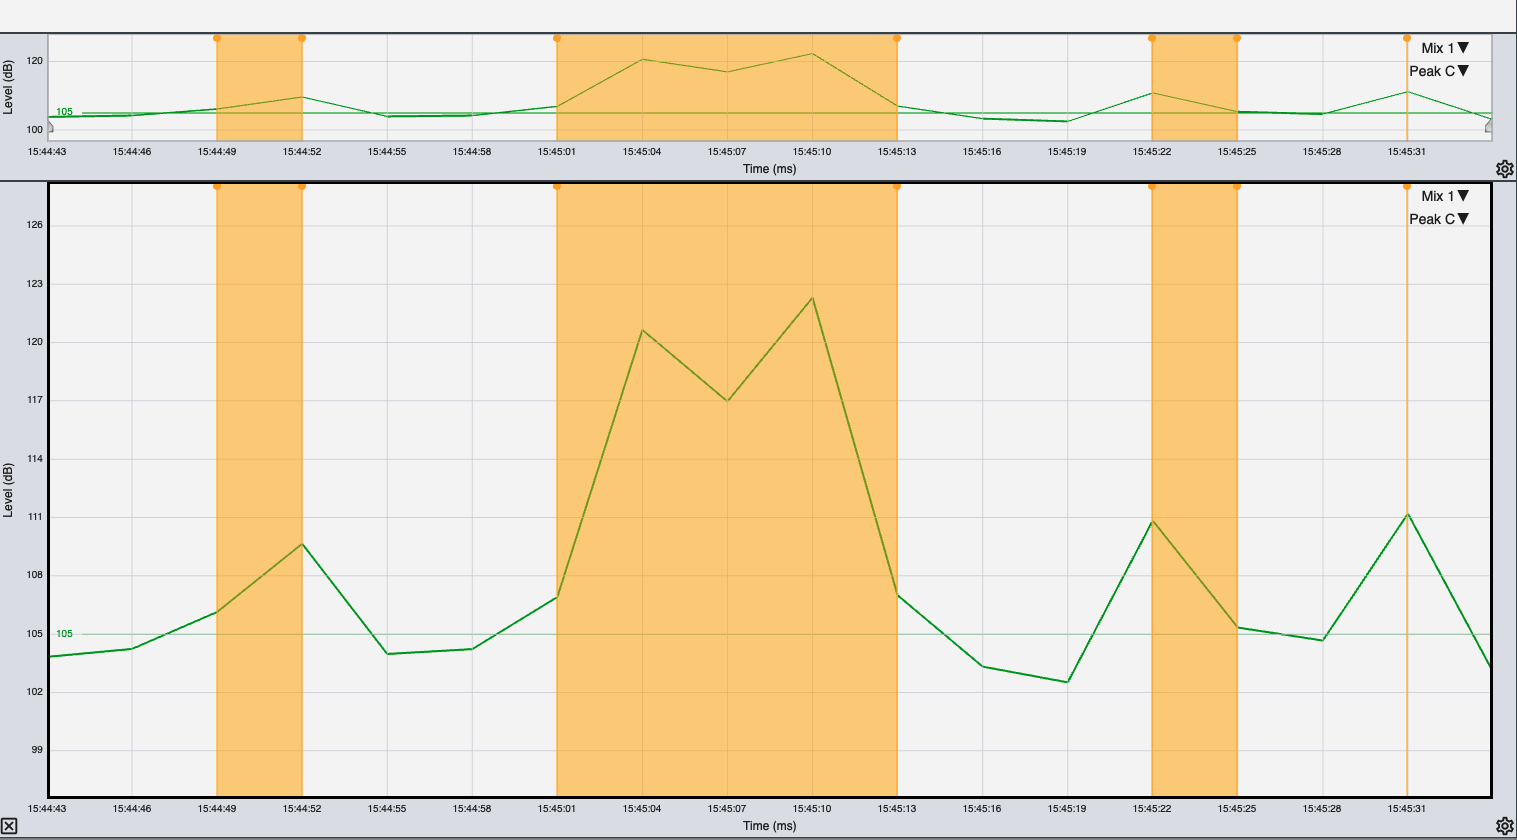
SPL Log featuring orange alarm highlights and lollipops.
Overloads (Red)
When Smaart detects an overload condition in an incoming Signal (three consecutive samples at 0 dBFS), all averaging buffers are flushed to remove the undefined values and will begin to refill as soon as the overload condition passes. Overload events are entered into the logfile. They are also indicated both by a red lollipop marker on the SPL history timeline and by a red status indicator with the word “OVERLOAD” on the meter grid.
Working with SPL Logs
In both the Navigation and Detail panes, the Friendly Name of the input generating the data is displayed in the upper-right corner of the plot. Immediately below this info is the name of the currently displayed metric. Click the metric name (or the white arrow next to it) to open the metric selection dropdown list. The dropdown list displays all metrics contained in the current logfile. Check the box next to a metric to select it for display in the timeline.
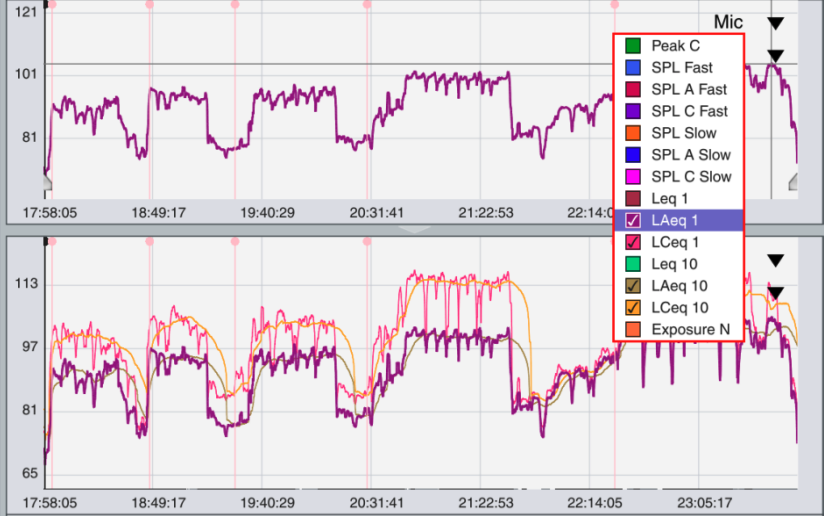
Metric selection dropdown list.
Click the name of a metric to bring it to the top of the z order or use the [Z] key to cycle which metric is on top. The metric that is currently at the top of the z order is also displayed above in the Navigation pane.
The Navigation pane will always automatically scale itself to display the entire logfile. The Detail pane will also automatically set its vertical scale as metrics are shown and hidden in order to properly accommodate the data being displayed. The Details pane, however, can be vertically zoomed in or out by pressing the [+] and [-] keys. The vertical scaling can be restored to its default (auto-fit) by clicking anywhere in the plot border.
Selecting a Time Range
The Detail plot can focus on a specific time range by dragging the arrowhead widgets that appear in the Navigation plot. By default, the arrowhead widgets appear in the bottom-left and bottom-right corners of the Navigation plot to indicate that the entire time range is being displayed. Dragging them inwards selects a shorter time range. The portions of the timeline data that lie outside the selected time range will be shaded to indicate they are not displayed in the detail plot.
Alternatively, double-clicking either widget will cause a text field to appear, allowing the entry of a specific time stamp within the log. Once a time stamp is entered, hit the [Enter] key to confirm and the widget will snap to that point in time. The time range selected by the widgets will then fill the Detail plot. You can also enter a time range direction into the Time Range field in the lower right corner, below the detail plot. For example, type 32:00 to set the time range to 32 minutes.
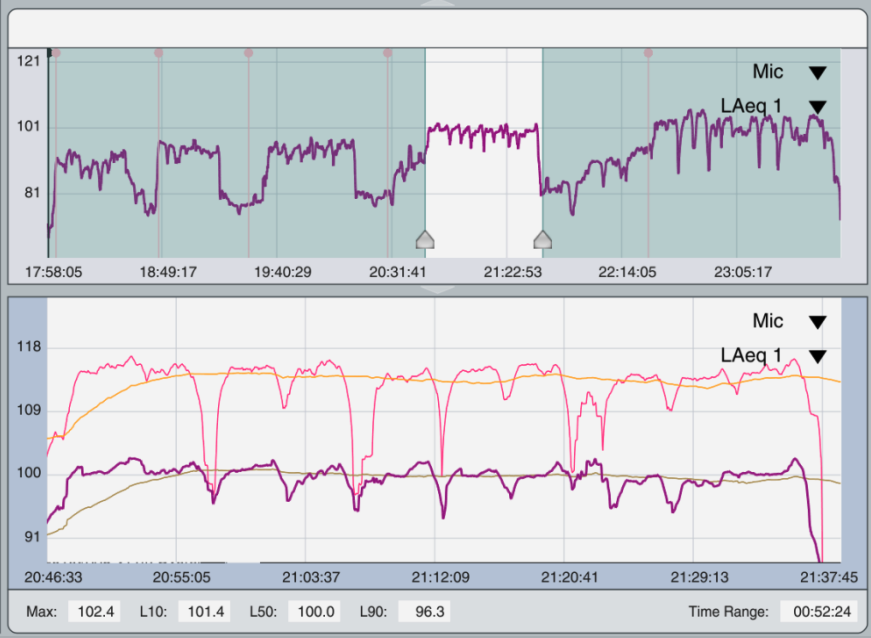
Using the time range sliders in the navigation pane to view 52 minutes and 24 seconds of log data in the detail pane.
When the selected time range is shorter than the total logfile duration, hovering the mouse cursor over the navigation pane between the two-time range selection widgets will turn the cursor into a hand icon. Click and drag left or right to move the selected time range. For example, if you have a five-minute time range selected, you can slide that five-minute selection left or right to see a different five minutes’ worth of data in the detail pane. Sliding the selection all the way to the right side of the navigation plot (most current data) will force Smaart to always show the most recent data as logging continues.