A note on the history of weighting curves
Based on research done in the 1930s, the A and C curves were intended to approximate the sensitivity of human hearing for pure tones as a function of frequency and sound level. A-weighting represented what was believed at the time to be equal loudness by frequency at low sound levels (40 phons), C-weighting was for loud sounds (100 phons) and there was a B curve in between for moderate loudness (70 phons).
Subsequent research has revealed that the A-weighting curve is really a better match for equal loudness at around 60 phons than for quiet sounds. C-weighting turns out to bear no real relationship to human perceptions of loudness (the old B curve would be a much better match for the 100-phon curve in ISO 226-2003) but is still considered useful for band-limiting sound level measurements to the approximate overall frequency range of human hearing.

A-Weighting
The A Weighting curve consists of a significant low-frequency roll-off and exhibits an Attenuation of about -20 dB at 100 Hz in combination with a slighter high-frequency roll-off. A-Weighting tends to correlate well with energy that lies in the human vocal range and is commonly used for real-time level monitoring by concert mix engineers. As such, the majority of sound level limit policies at live events specify an A-Weighted limit as averaged over a period of time.
Similarly, many environmental and nuisance noise regulations in the United States specify A-Weighting. Although this is largely a holdover from the now-defunct Noise Control Act of 1972, A-Weighting is a poor choice for nuisance noise applications (particularly in the context of live events). This is because the low frequencies de-emphasized by the A-Weighting curve are the most likely to propagate far distances outdoors and transmit most efficiently through structures, and therefore most likely to generate noise complaints. This leaves the measurement unable to accurately characterize the sounds it is designed to regulate.
A-Weighting is also used for most health and safety regulations concerning sound exposure. It may not be intuitively obvious why this is the case, as the A-Weighting curve bears little resemblance to the tonal response of human hearing at high levels. While this may be so, the current audiological consensus is that that A-Weighted sound level measurements correlate well with statistical data on noise-induced hearing loss. Because of this, the A-Weighting curve is considered to reasonably approximate the diffuse-to-DRP Transfer Function of the human hearing mechanism and is then, in turn, effective at characterizing sound exposure risk.
Additional research, however, has shown that LF energy can present a hearing health risk at high levels.
C-Weighting
The C-Weighting curve is effectively broadband, exhibiting a slight roll-off at the frequency extremes. For this reason, C-Weighting is commonly used to characterize broadband content such as live music, including the subwoofer region. The slight roll-offs can be useful for restricting the measurement to the range of energy commonly emitted by a sound system while de-emphasizing low frequency structure-borne vibrations, rumble, and so forth. It is often stated that C-Weighting resembles the tonal response of human hearing at concert levels. However, when comparing the A- and C-Weighting curves against the 100-phon Equal Loudness Contour (like in the below plot), we see that this is not the case.
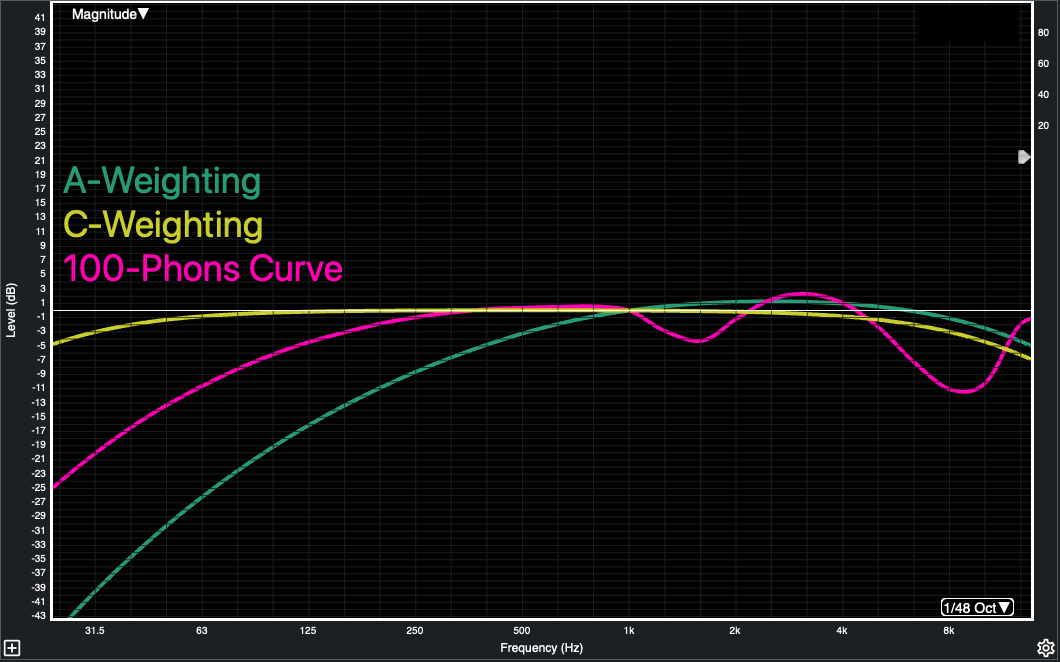
Therefore it is better to apply the rule-of-thumb: C-Weighting is best used for when we wish to include most of the low frequency energy in our measurement, and A-Weighting is best used for when we don’t.
C-A-Weighting
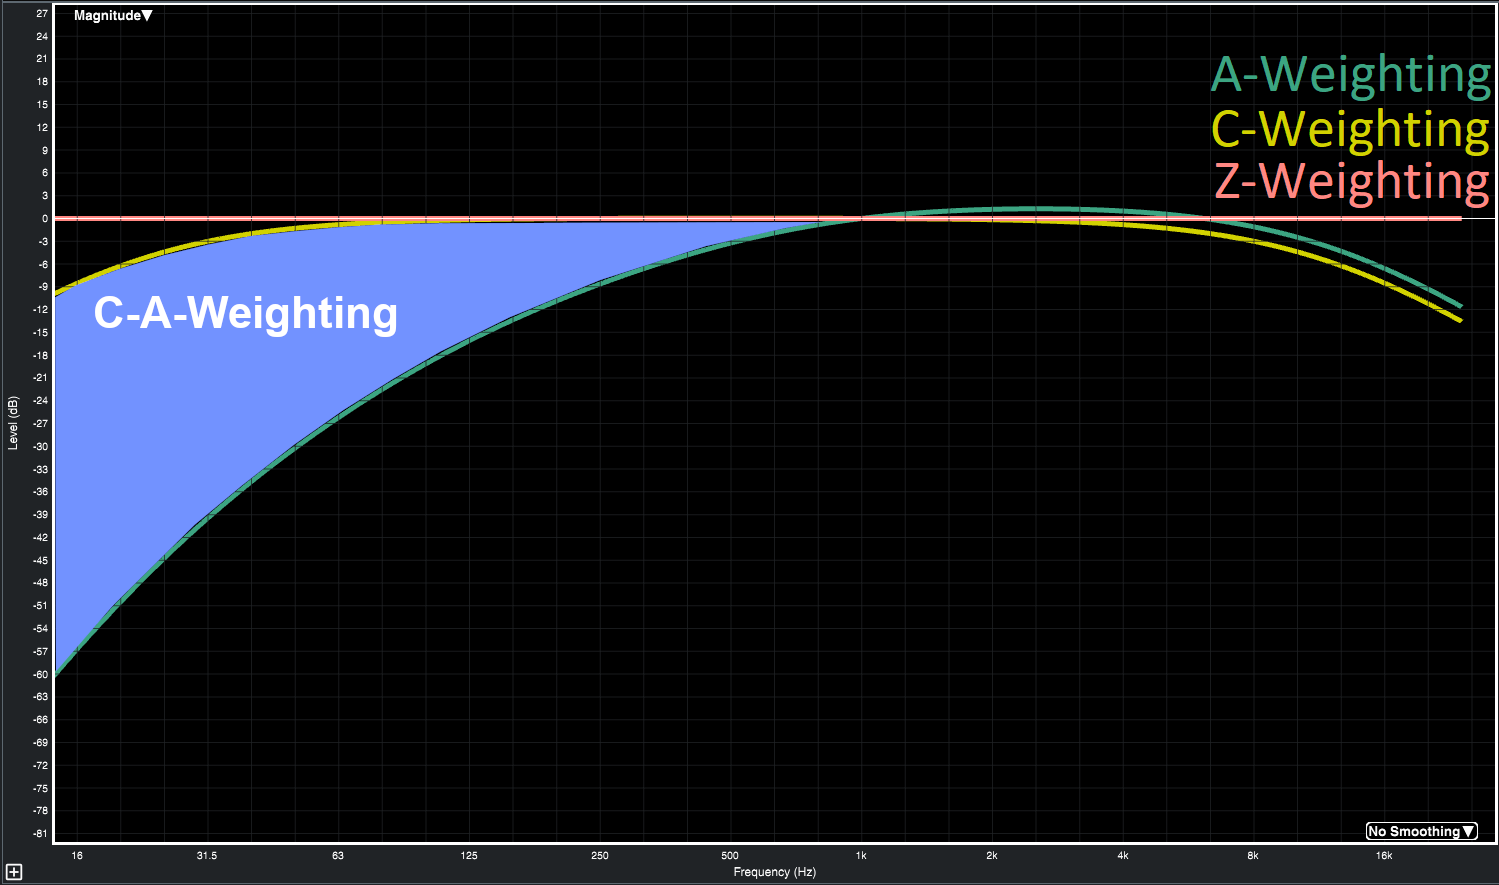
C-A-Weighting is exactly what it sounds like – the difference between the C-Weighted and A-Weighted sound levels. C-A-Weighted measurements will show low values when most of the Signal’s energy is concentrated at higher frequencies (such a speech signal), and higher values when more of the energy is concentrated at low frequencies (such as live music). C-A is often used as an indicator of the overall spectral balance of a mix and is useful for evaluating potential low frequency sound exposure risk.
The current recommendation from the AES Technical Committee on Acoustics and Sound Reinforcement is that when the measured C-A exceeds 20 dB, it indicates that the signal contains significant energy distributed in the low-frequency region. This is useful, as the traditional A-Weighted sound exposure metrics may not fully characterize this potential risk.
Z-Weighting
Unweighted (also called “Z-weighted”) measurements are taken with a flat frequency response or, in other words, no frequency weighing applied to the measurement. It is most often used when the measurement needs to accurately characterize energy at both extremes of the audible range (below 30 Hz and above 10 kHz). It is of limited use in live sound applications, but it can be useful for loudspeaker testing applications and acoustical evaluations.
Octave-Banded Measurements
Smaart SPL offers the ability to measure sound levels in octave-wide bands, centering on frequencies from 16 Hz to 16 kHz. This is a useful tool for studying and documenting how sound level energy is distributed over frequency. For example, examining energy within the 63 Hz octave band can help indicate whether a level overage occurred because of the PA system or a cheering crowd. Octave-banded sound level data can also help characterize nuisance noise along a property line.